Free Tool
22 Years of Gold on One Chart.
Practise XAUUSD setups from 2004 to 2026 with bar replay, position tools and outcome checks. Free, no sign-up.
Why we built it.
Most free charting sites keep hourly gold history back to about 2017. That leaves out 2008, the 2011 top and the 2013 crash, the years that test a discretionary setup hardest. This chart puts the full hourly record back in reach.
- Hourly candles from June 2004 to August 2026
- 1H, 2H, 3H, 4H, daily and weekly views
- Times converted from broker server time to real time
- Shown in UTC+4, UTC, London, New York or UTC+5:30
What it does.
Position tool
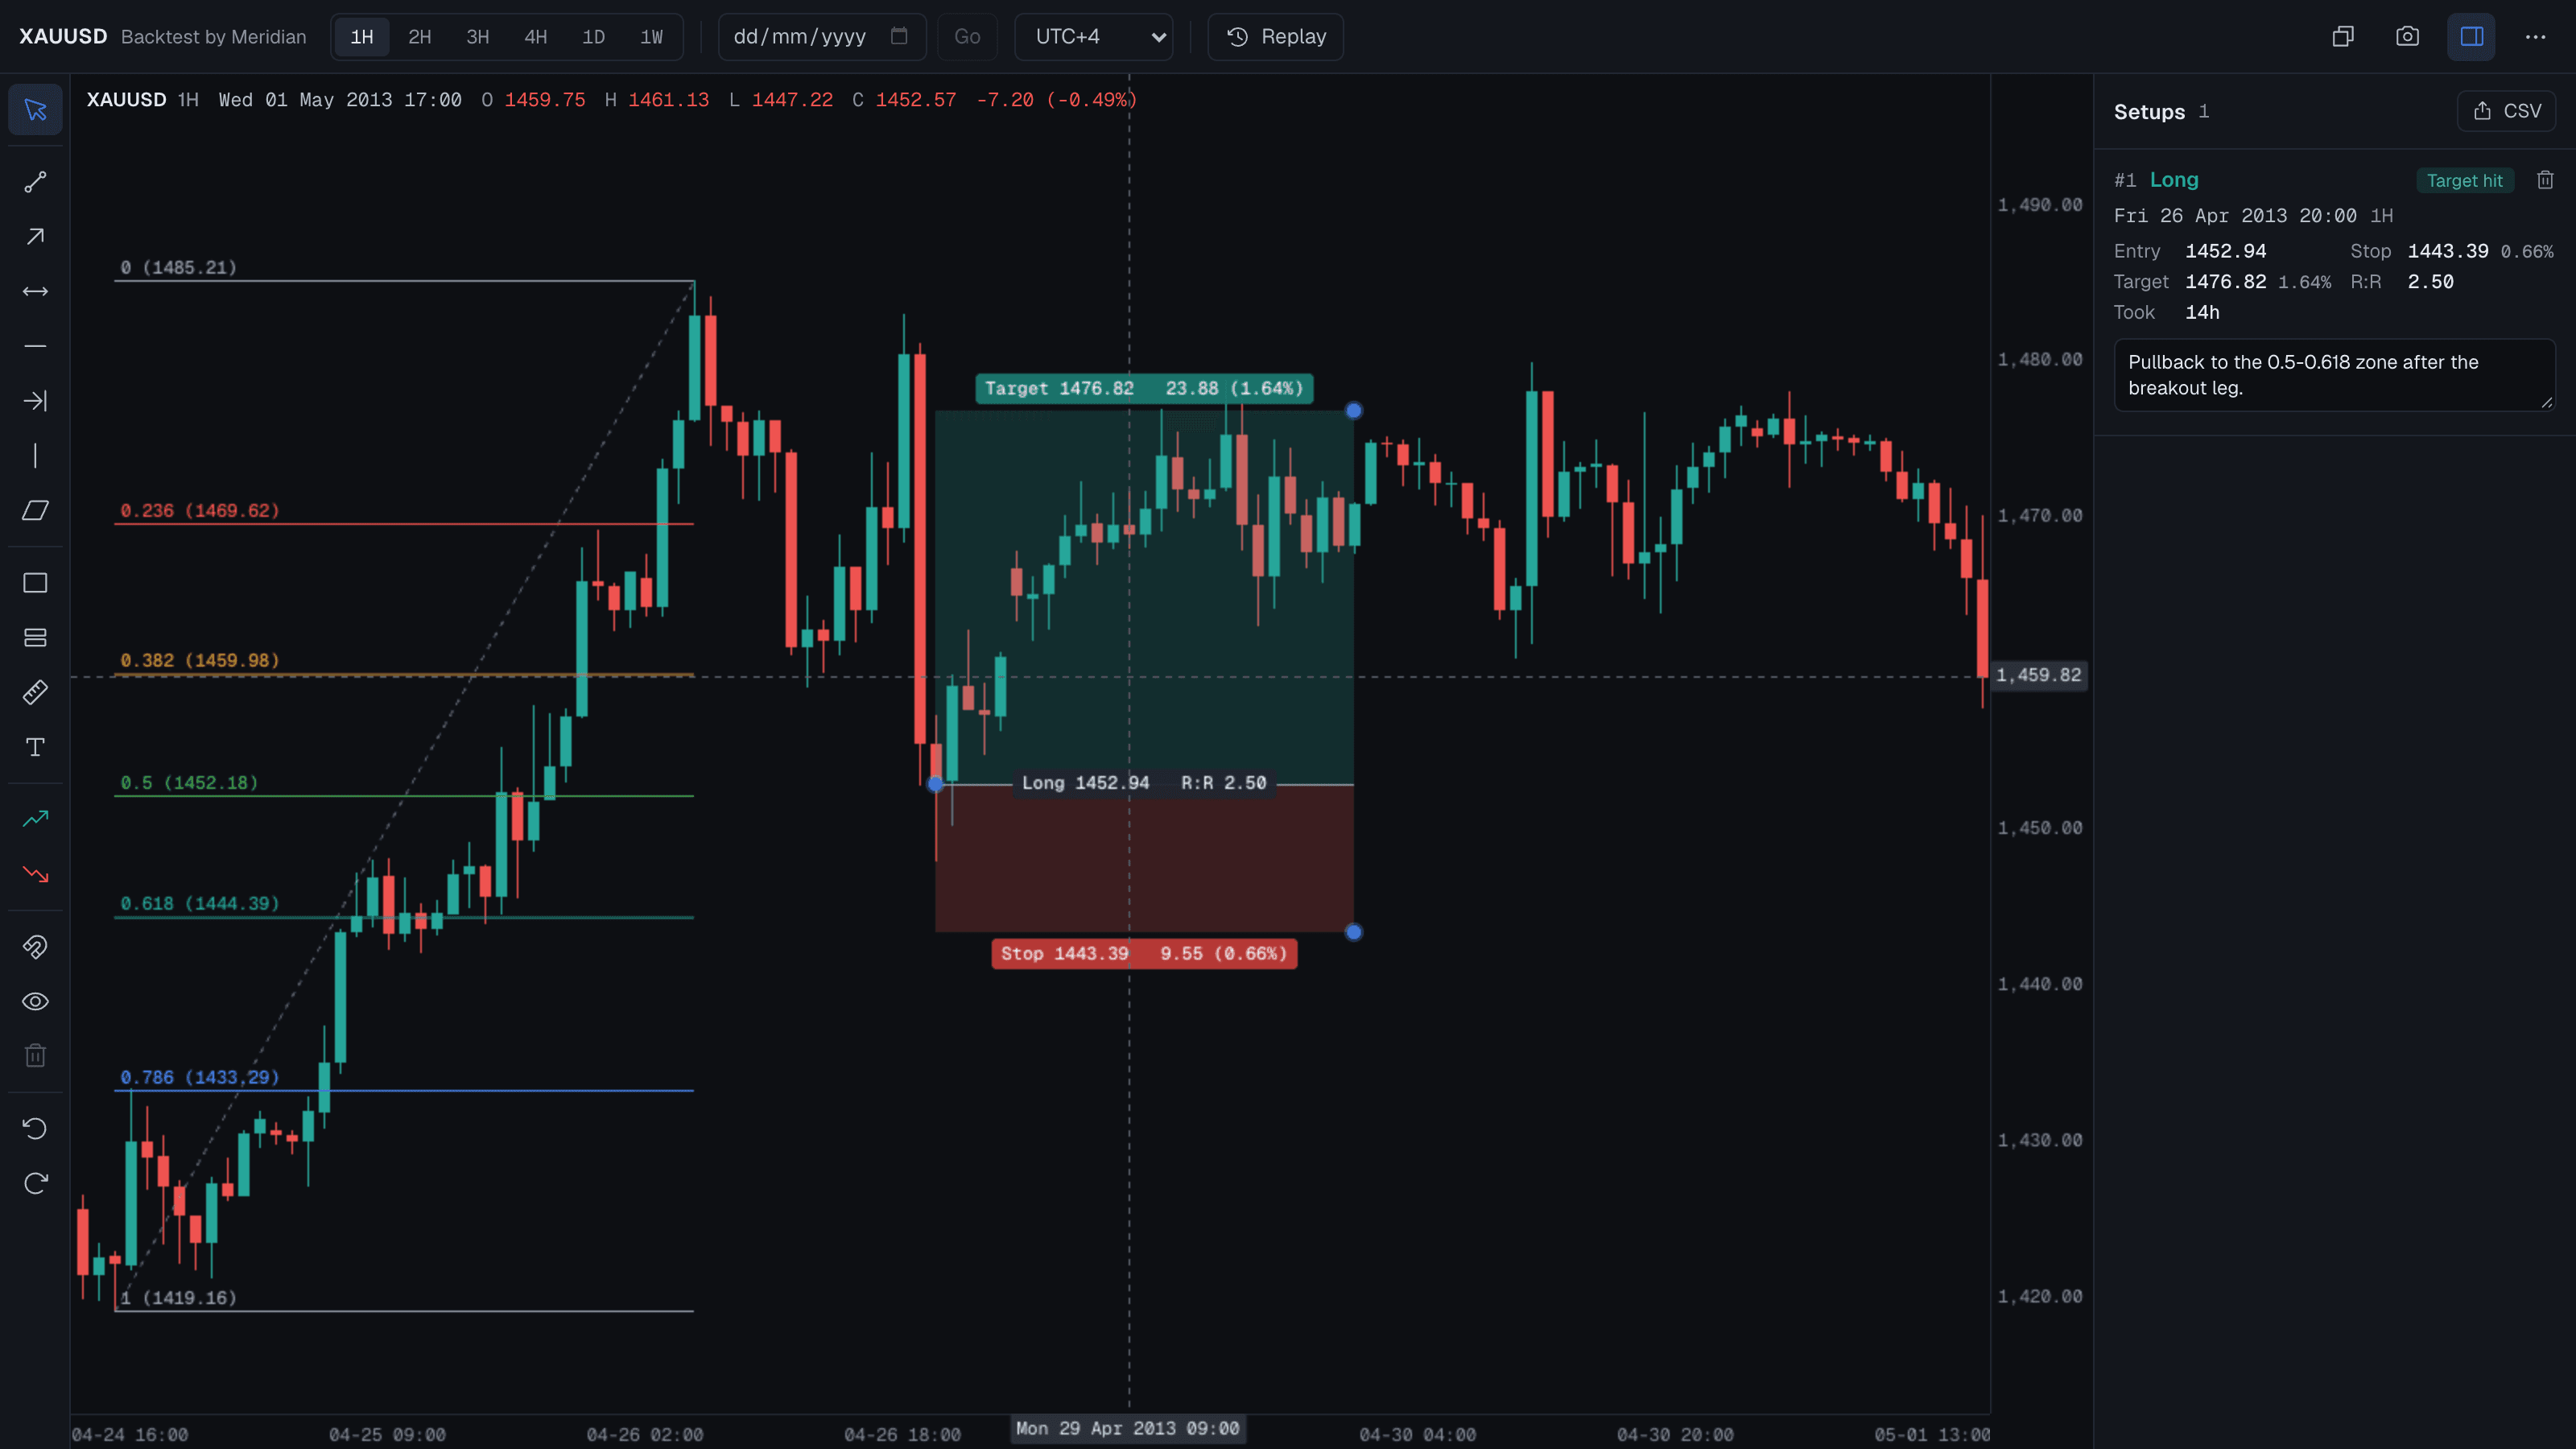
Entry, stop and target with risk and reward in points, percent of price and R:R.
Outcome check
Every setup is walked forward on hourly data to show which level was hit first and how long it took.
Bar replay
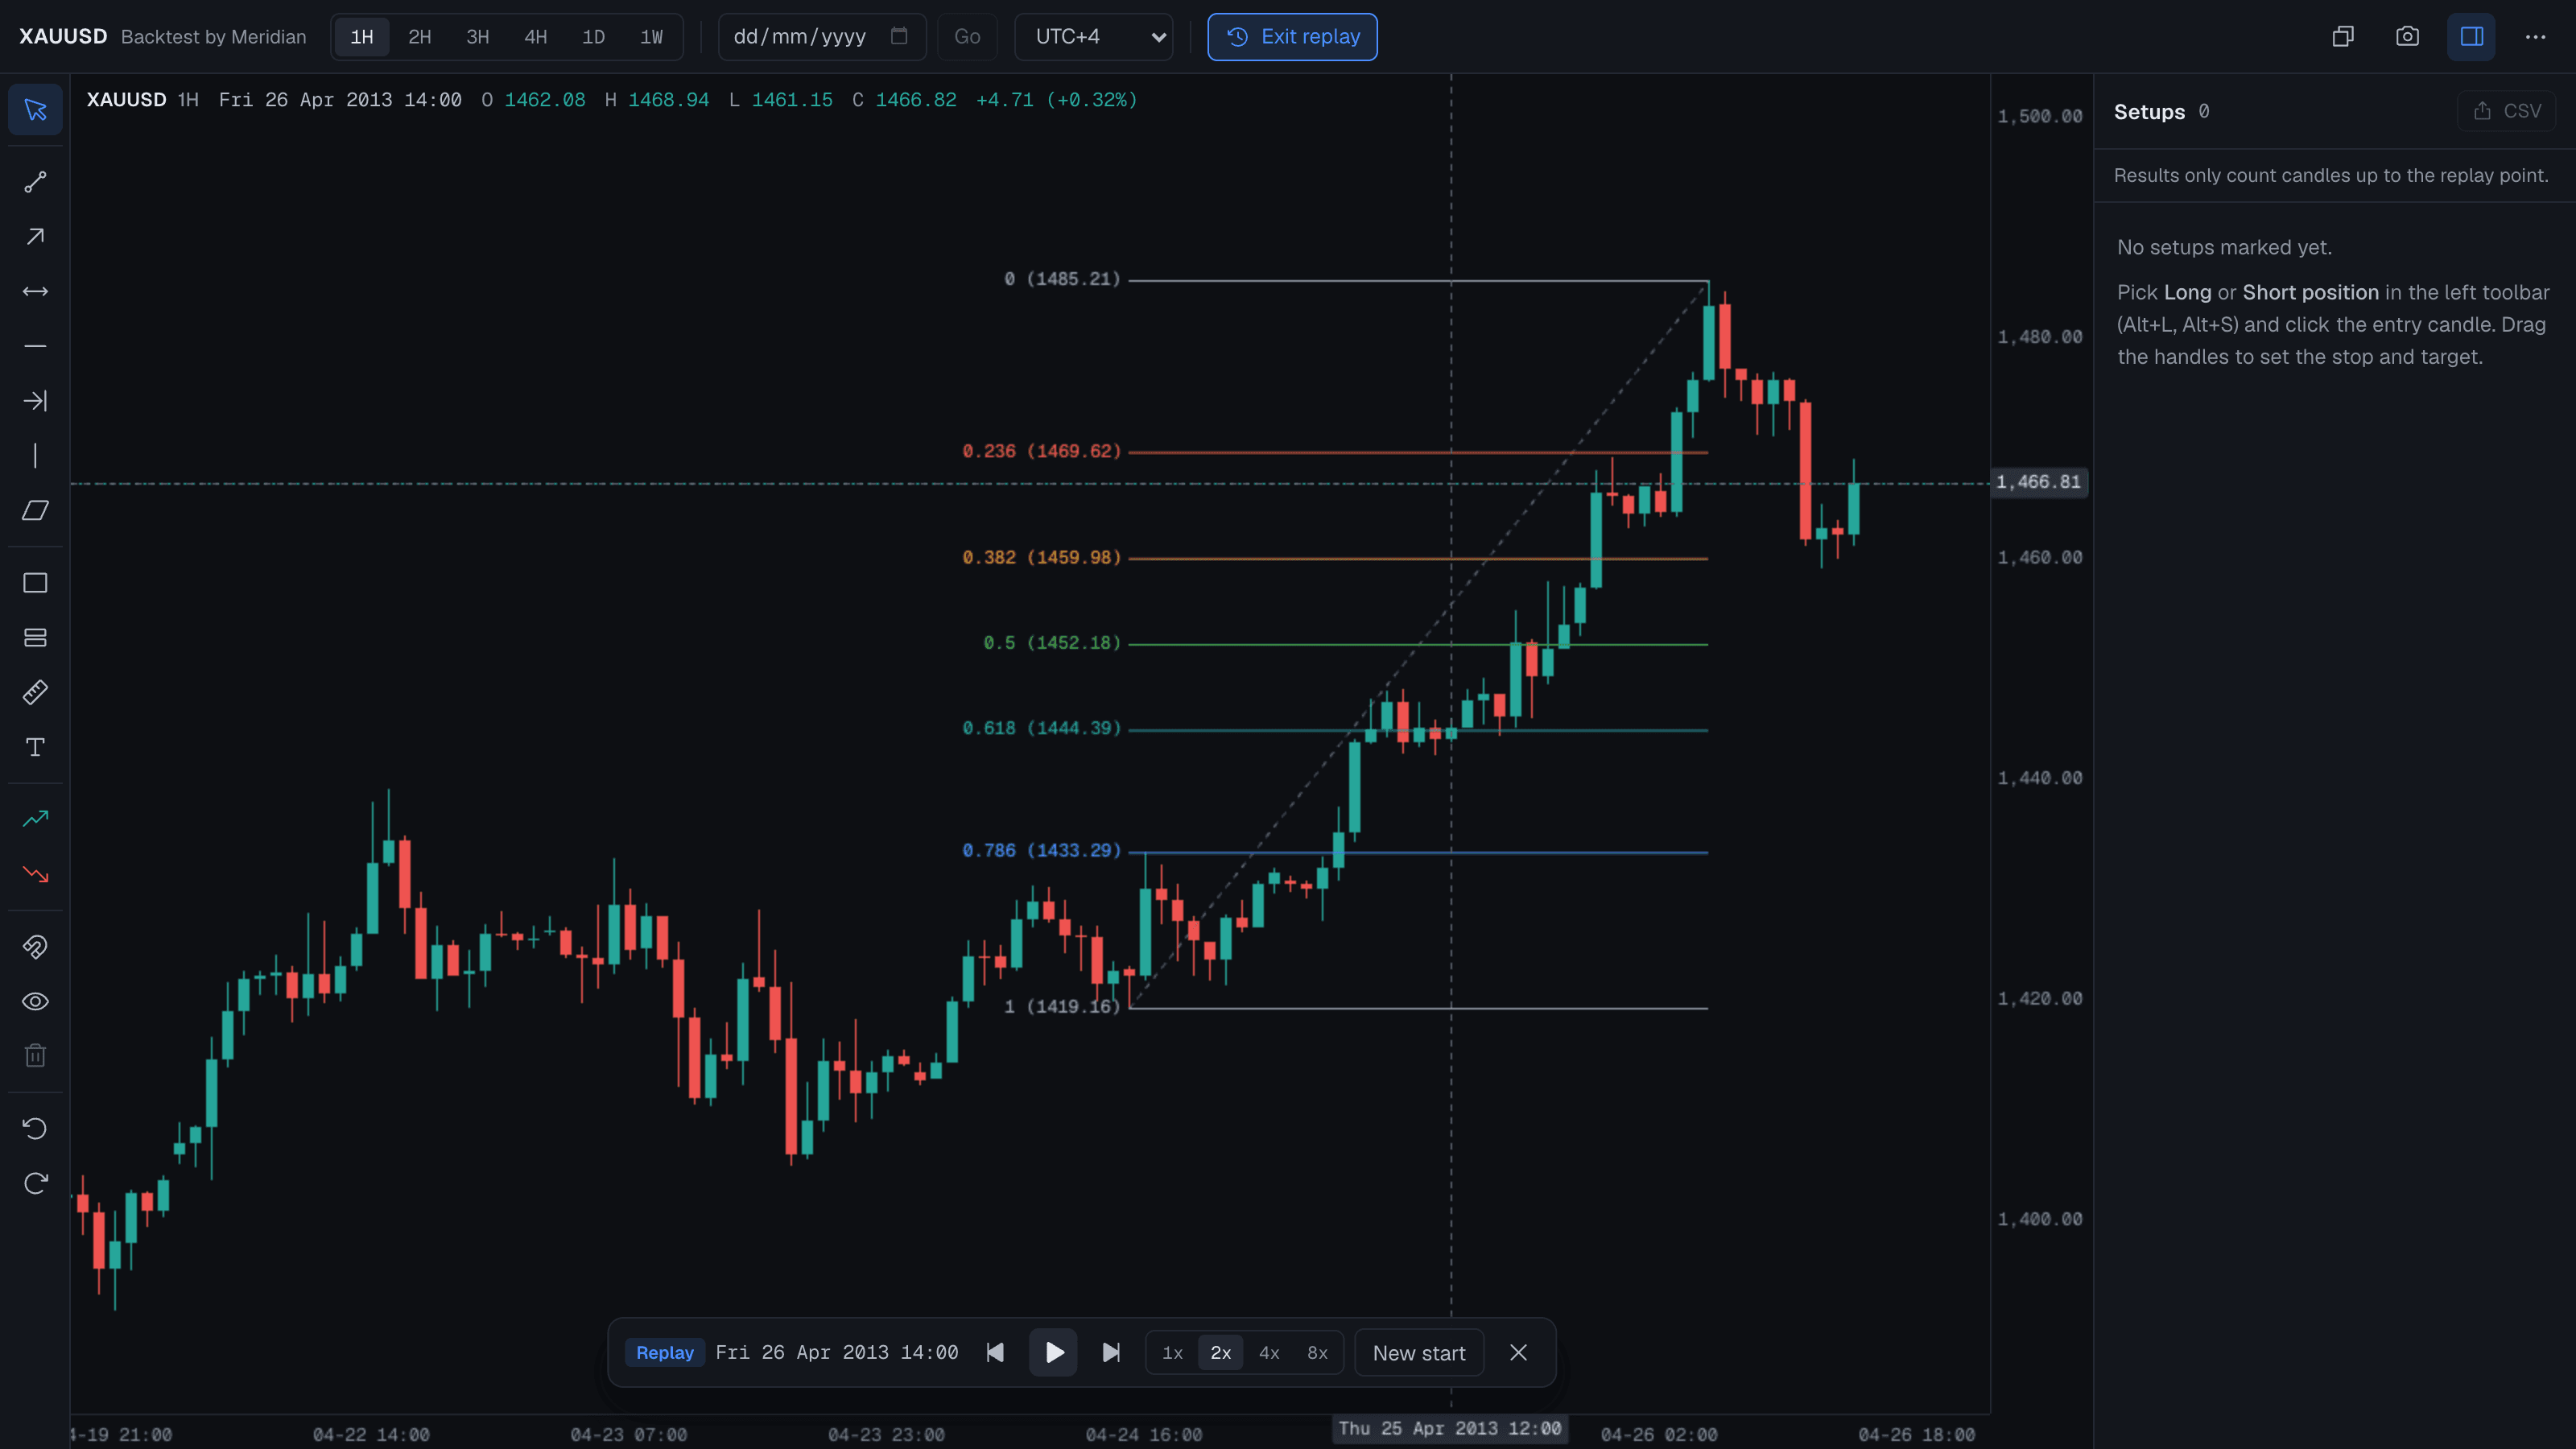
Hide the future, then step or play forward. Higher timeframe candles are rebuilt from the hours revealed so far.
Drawing tools
Trend lines, rays, horizontal and vertical lines, channels, rectangles, fib retracement, measure and notes.
Snapshots and export
Download or copy the chart as an image, and export every setup to CSV for a trading journal.
Indicators
Moving average, EMA, Bollinger Bands, volume, RSI and average daily range, each with its own length.
Keyboard first
Familiar shortcuts for tools, timeframes, zoom, undo and replay. Press ? inside the chart for the list.
Clean history
Hourly gold prices from June 2004 to August 2026 on six timeframes, converted to real time and checked for gaps.
A practice session, start to finish.
Replay keeps you honest: you decide with only the candles a trader would have seen, then let the market answer.
- Pick a dateAny candle from 2004 onwards
- Start replayEverything after it is hidden
- Mark the setupLong or short, stop and target
- Step forwardOne candle at a time, or play
- Read the resultTarget hit, stop hit or still open
- ExportImage for review, CSV for the journal
Free, private and honest about the data.
There is no account and nothing to install. Drawings and setups stay in your own browser, and a backup file moves them to another device. The prices are historical broker data, checked for gaps and converted to real time.
- No sign-up, no tracking of your setups
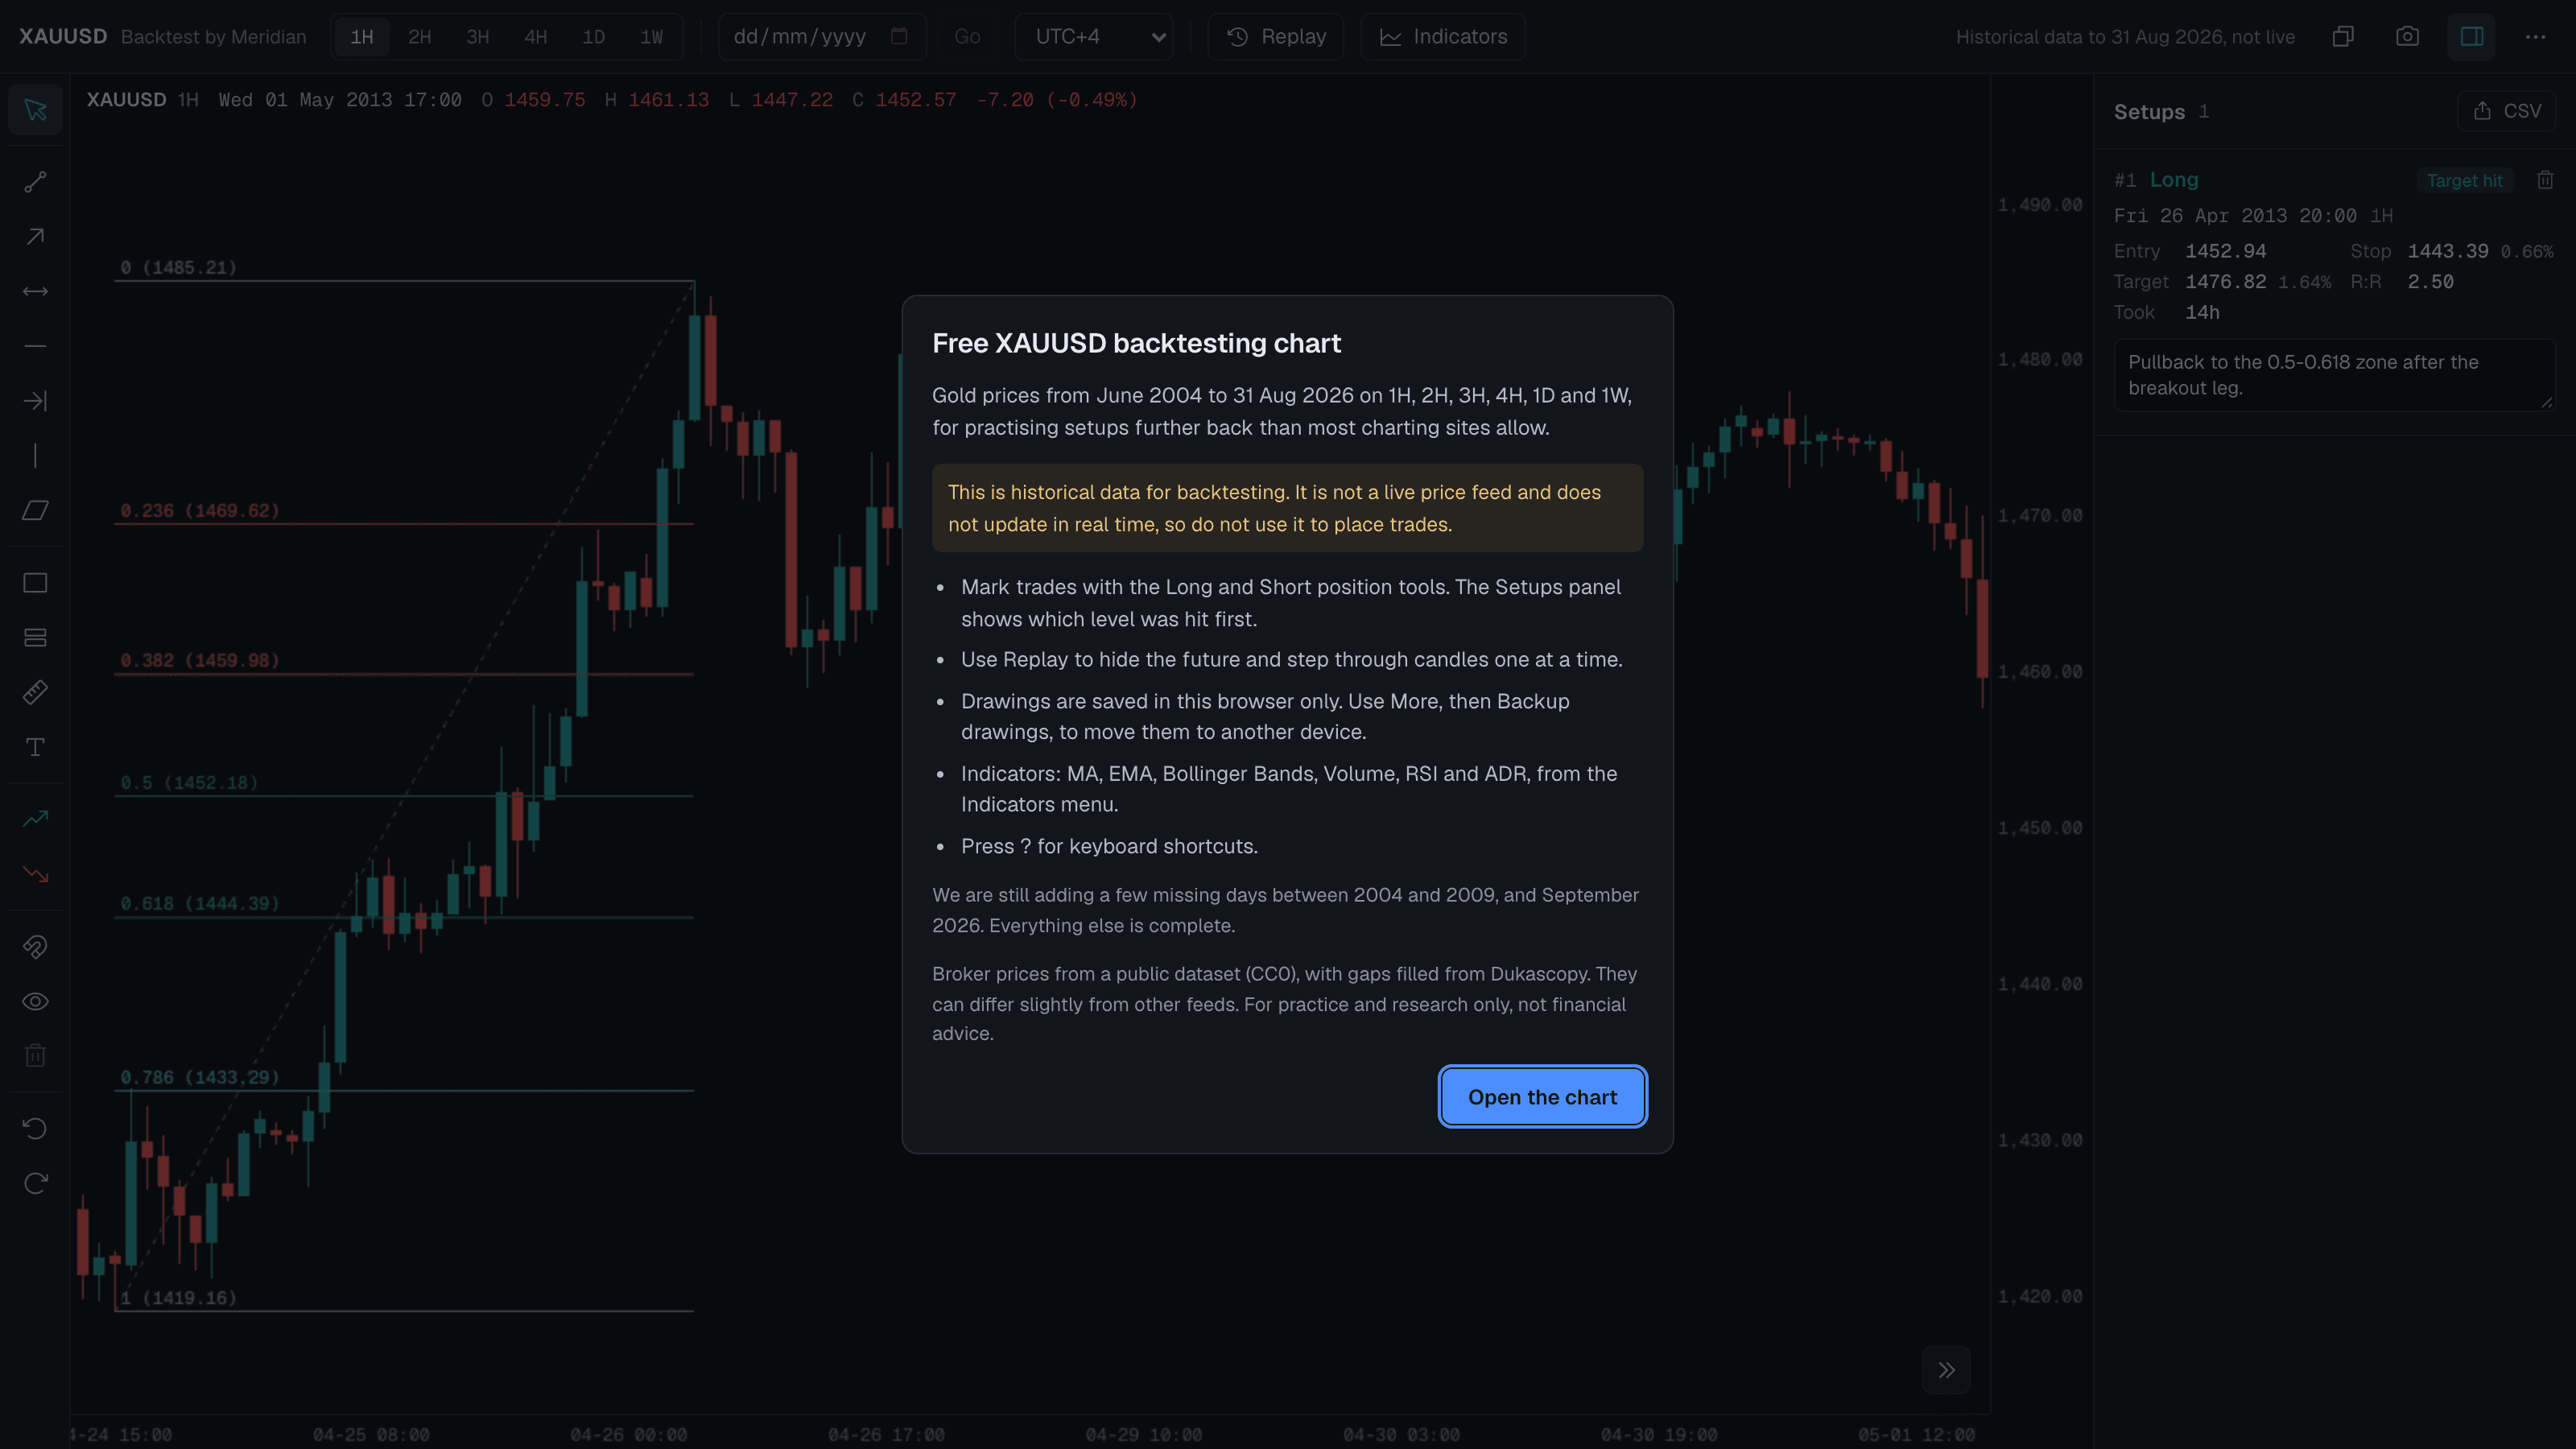
- Historical data for backtesting, not a live price feed
- Missing trading days filled from a second source
- Built by Clarivon Solutions as a working example of our charting work
Questions.
Is it really free?
Yes. There is no paid tier and no account. Open the chart and start.
Where are my drawings saved?
In the browser you draw in. Use More, then Backup drawings, to save a file you can restore on another computer or browser.
Where do the prices come from?
Historical XAUUSD broker prices, checked for gaps and converted from broker server time to real time. Broker feeds differ slightly from each other, so candles may not match another platform to the cent. We are still adding a few missing days between 2004 and 2009, and September 2026.
Are these live prices?
No. The chart holds historical data for backtesting and practice, and it does not update in real time. Use your broker's platform for live prices and trading.
Which timezone are the candles in?
The source is broker server time. We converted it to real time using the US jobs report release as a reference, and you can view it in several timezones. Daily candles close at the New York close.
Is this trading advice?
No. It is a practice and research tool. Results on historical data do not predict future results.
Want your own strategy tested?
We hold the full price history behind this chart. Send us your rules and we will quote first, then run the backtest and mark every entry, stop and target on the chart, so you can check each trade against your parameters.
- A quotation before any work starts
- Every trade marked on the chart for review
- Win rate, R multiples and drawdown summarised
- Your rules written down, so the test is repeatable
Equity curve
- Period
- Jan 2019 to Dec 2025
- Model
- Every tick, real ticks
- Trades
- 1,284
- Profit factor
- 1.41
- Max drawdown
- 11.8%
- Out-of-sample
- 2024 to 2025 held back
Illustrative report layout with simulated figures. Historical backtesting and optimisation do not guarantee future trading results.
For practice and research only. Historical prices and simulated outcomes do not guarantee future results, and nothing on this chart is investment advice or a trading signal. Price data: public-domain broker dataset (CC0) and Dukascopy Bank SA.
Want a Tool Like This for Your Desk?
We build charting, backtesting and research tools for traders, prop firms and brokerages, from the data pipeline to the interface.